Guide updated:
Inspect how frequencies change over time and export an available visualization.
Open this guide using the “How to use this tool” link below the tool name. It includes steps, screenshots and videos for computers and phones.
Before you start
Use an audio recording you have permission to inspect. A spectrogram is a visualization, not an automatic identification of every sound.
Try with a demonstration file — audio.mp3
These small files were created for this guide and contain no personal data.
Step-by-step instructions
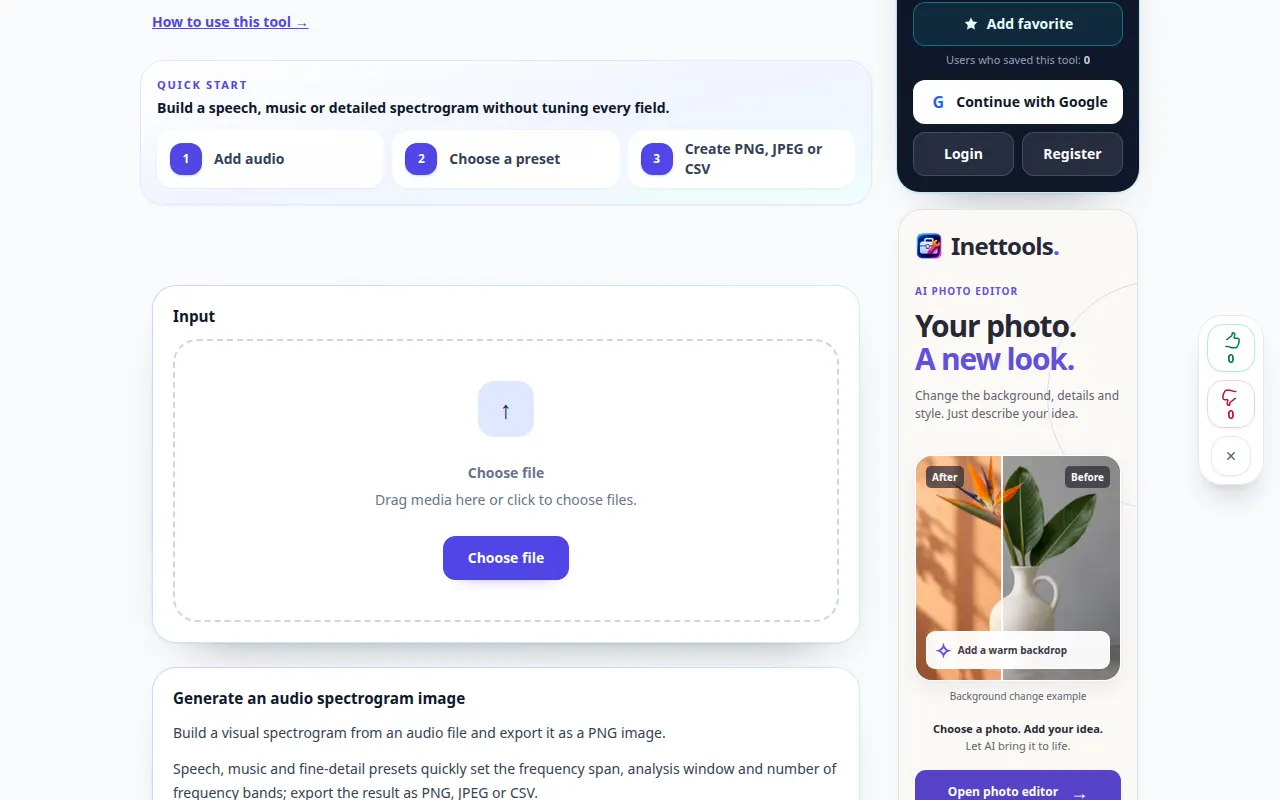
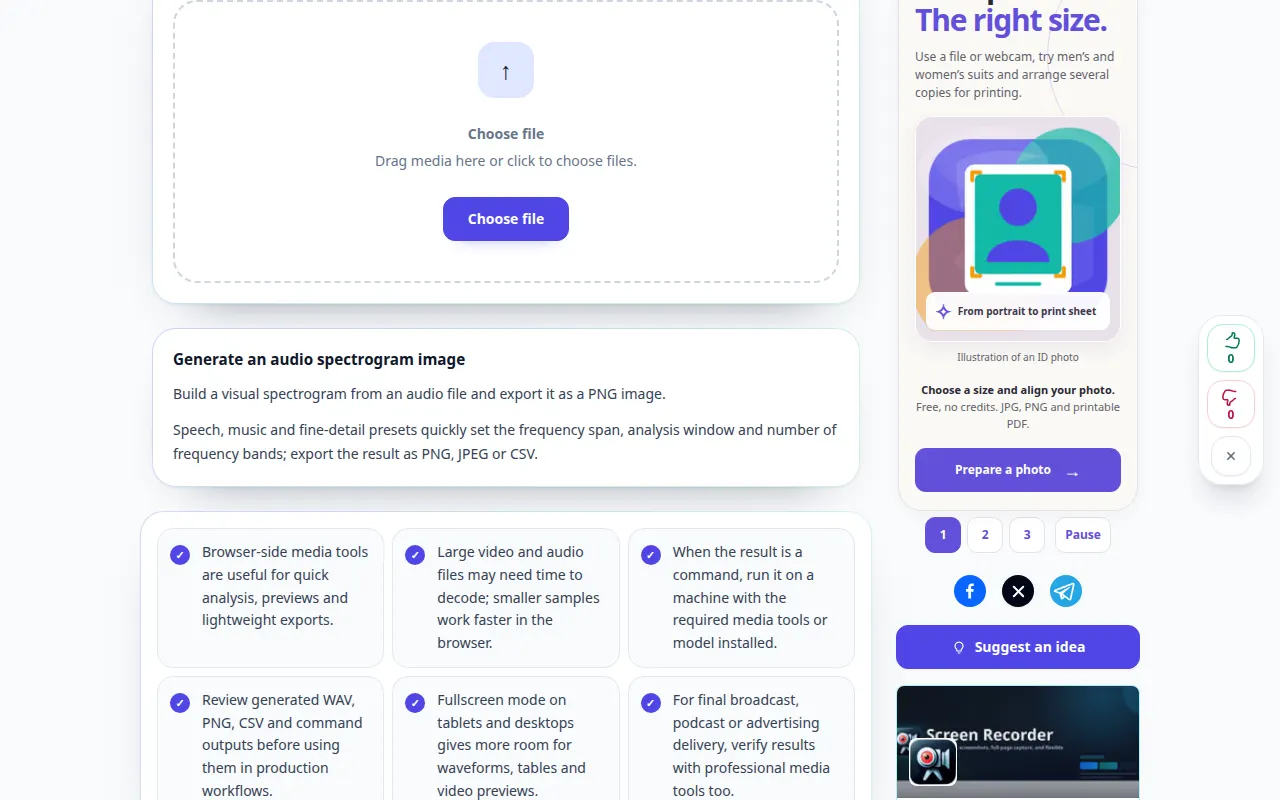
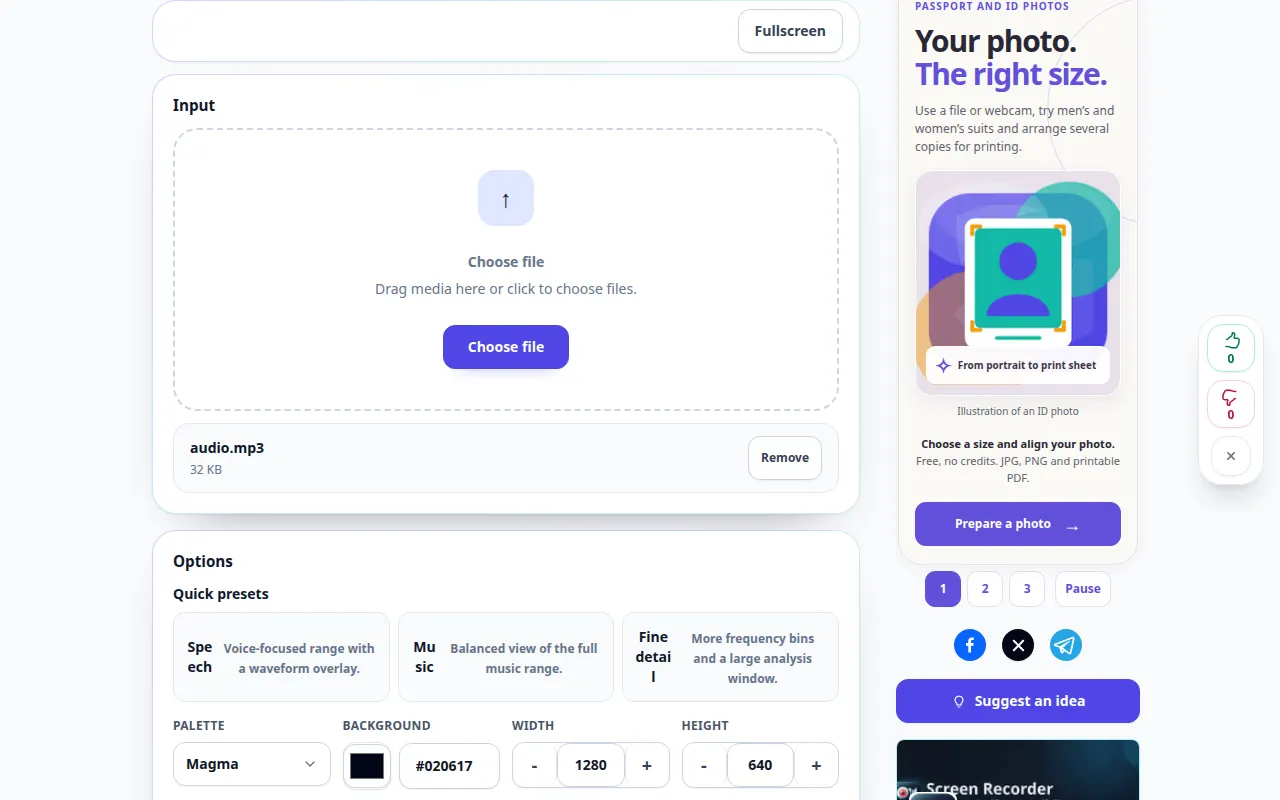
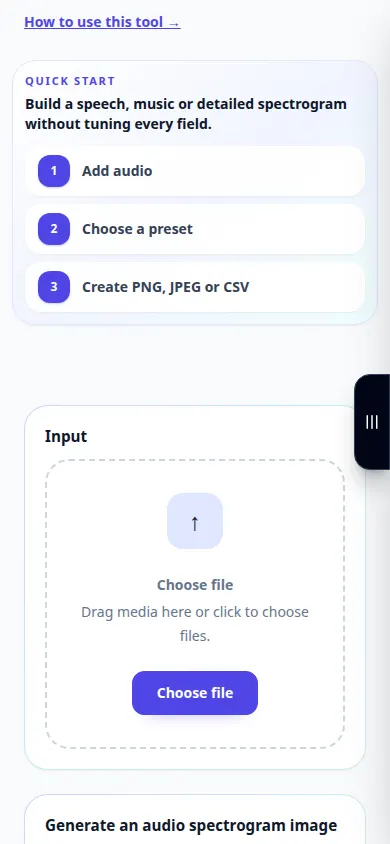
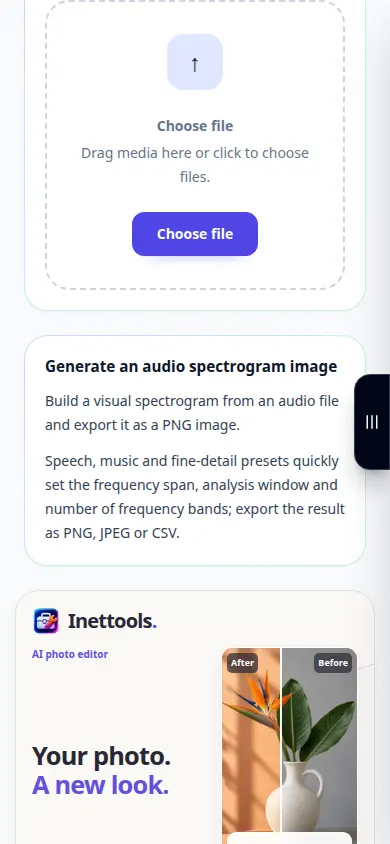
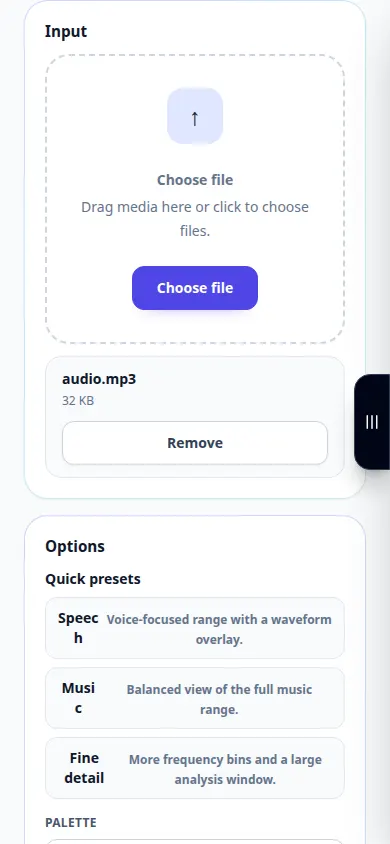
- Choose the audio file and wait for the waveform or spectrogram workspace.
- Select the available frequency range, channel and display options.
- Adjust the analysis resolution if offered: more time detail and more frequency detail involve a trade-off.
- Generate or refresh the view, then inspect a known section of the recording.
- Use the offered image or data export and record the settings used for a meaningful comparison.
On a computer
Use the full-width working panel to compare the source, settings and result. Keep the original file so you can try another setting without replacing it.
On a phone
Choose the source from Files or your device file manager. Scroll down to the settings and result; keep this tab open until the operation finishes.
In Safari on iPhone, open the sharing menu and choose Save to Files if the result opens in a new tab. In Android Chrome, check Downloads. Keep this tab open until processing finishes.
For a better result
Compare recordings with the same display scale and analysis settings; different colors alone do not prove a sound-quality difference.
Screenshots and video
Desktop demonstration
The recording shows the English interface. Follow the translated steps above; the controls are in the same order. This recording shows the source and available settings before the main action. Follow the steps above to start processing and save the result.
Phone demonstration
The recording shows the English interface. Follow the translated steps above; the controls are in the same order. This recording shows the source and available settings before the main action. Follow the steps above to start processing and save the result.
Questions and troubleshooting
Why are short sounds smeared across time?
The analysis window controls the time and frequency resolution. Try another available window size.
Does a missing high-frequency band prove the file is fake?
No. Recording equipment, processing and compression can all limit frequency content.
If you see a message that the service is overloaded, wait and try again later. A failed attempt does not mean that your source file has changed.